In 2016, the 2015 global wine market was valued in €28.3 billion [6]. With such a large value, it makes sense to employ data science techniques to understand what physical and chemical properties affect wine quality.
In this series of posts, I will work with the chemical components of the Vinho Verde wine (using the dataset provided in the reference [2]) to
- Reproduce the findings of the references [7] and [8];
- Use machine learning to classify wine, and compare my results with [1];
- Propose a strategy to improve the value of the wine analysed.
The data set [2] includes 1599 red wines and 4898 white wines. The chemical components identified in this data set are
1 - fixed acidity [g(tartaric acid)/dm^3]
2 - volatile acidity [g(acetic acid)/dm^3]
3 - citric acid [g/dm^3]
4 - residual sugar [g/dm^3]
5 - chlorides [g(sodium chloride)/dm^3]
6 - free sulfur dioxide [mg/dm^3]
7 - total sulfur dioxide [mg/dm^3]
8 - density [g/cm^3]
9 - pH
10 - sulphates [g(potassium sulphate)/dm^3]
11 - alcohol [vol.%]
12 - quality (score between 0 and 10)
A comment on the data set features [3, 4, 5]:
- For wines, total acidity is usually divided into two groups, namely the volatile acids and fixed (nonvolatile) acids. The predominant fixed acids found in wines are tartaric, malic, citric, and succinic. All of these acids originate in grapes with the exception of succinic acid, which is produced by yeast during the fermentation process;
- Residual Sugar (RS) is the level of glucose and fructose (grape sugars) that are not converted into alcohol during fermentation (most commonly measured in grammes/litre). It is one of the components employed to classify wine as dry or sweet;

Classification of wine, according to “sweetness”. Image from Wine Folly (http://winefolly.com/tutorial/wines-from-dry-to-sweet-chart/) - Chlorides correspond to the amount of salt in the wine;
- Sulfur dioxides and sulphates are additives to the wine. It has two important roles. Firstly, it is an anti-microbial agent, and as such is used to help curtail the growth of undesirable fault producing yeasts and bacteria. Secondly, it acts as an antioxidant, safeguarding the wine’s fruit integrity and protecting it against browning;
- Alcohol content in wine ranges from 5.5% to 23% ABV. There are several factors that affect the alcohol content of wine including the style of wine, quality level, and climate where the grapes grow.
Analysis of red wines
The following histogram shows the distribution of red wines according to the quality index.

Chemicals that have a predominant influence on the quality classification
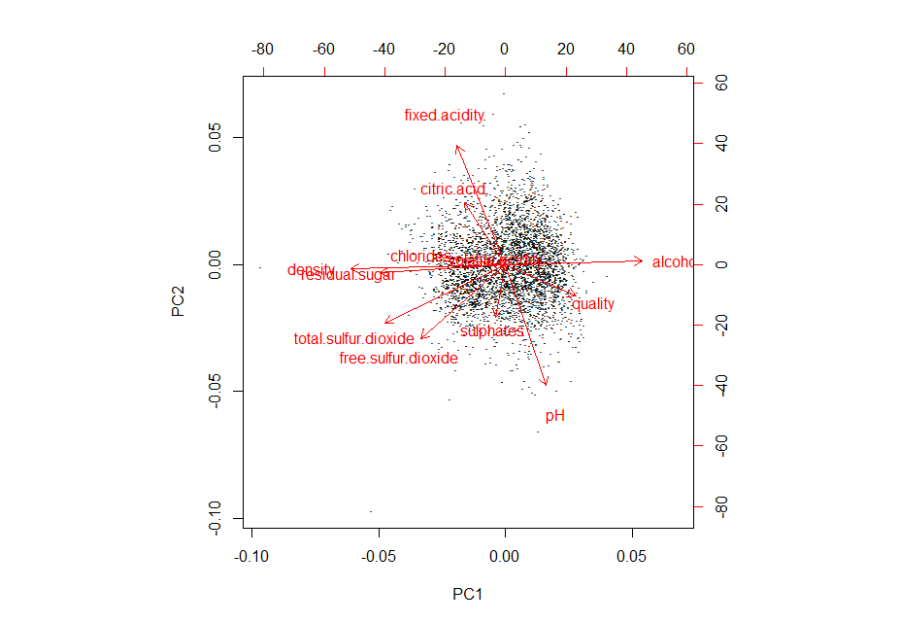
Using PCA, we obtain can construct the following graph to visualise how the wine features are related to the two principal components.

The first and second components (PC1 and PC2) are dominated by Acidity and Alcohol, respectively.
Relation between wine quality, fixed acidity and alcohol content
In the following graphs, we can see the fixed acidity and alcohol content data are related to the quality index. Also, how those data are related among them.
Analysis of white wines
Analogously to the analysis of red wines, the following histogram shows the distribution of white wines according to the quality index.

Chemicals that have a predominant influence on the quality classification
Using PCA, we obtain can construct the following graph to visualise how the wine features are related to the two principal components.
The first component (PC1) is dominated closely by Density and Alcohol. While the second component (PC2) is dominated by Acidity (high contributions of pH and fixed acidity).
Relation between wine quality, fixed acidity and alcohol content
In the following graphs, we can see the fixed acidity and alcohol content data are related to the quality index. Also, how those data are related among them.
Making sense of the findings
According to PCA, acidity plays an important role on the wine quality. Indeed, acids are major wine constituents and contribute greatly to its taste. In fact, acids impart the sourness or tartness that is a fundamental feature in wine taste. Wines lacking in acid are “flat.” Chemically the acids influence titrable acidity which affects taste and pH which affects colour, stability to oxidation, and consequently the overall lifespan of a wine.
Alcohol, on the other hand, according to the wine production. From this analysis, an alcohol concentration from 11.5 to 12.5 produce the best wines.
References
[1] P. Cortez, A. Cerdeira, F. Almeida, T. Matos and J. Reis, “Modeling wine preferences by data mining from physicochemical properties”. In Decision Support Systems, Elsevier, 47(4):547-553, 2009.
[2] Paulo Cortez, University of Minho, Guimarães, Portugal, http://www3.dsi.uminho.pt/pcortez A. Cerdeira, F. Almeida, T. Matos and J. Reis, Viticulture Commission of the Vinho Verde Region(CVRVV), Porto, Portugal. (https://archive.ics.uci.edu/ml/datasets/wine+quality)
[3] http://waterhouse.ucdavis.edu/whats-in-wine/fixed-acidity accessed on Jul 2017
[4] http://winefolly.com/tutorial/wines-from-dry-to-sweet-chart/ accessed on Jul 2017
[5] http://www.aromadictionary.com/articles/sulfurdioxide_article.html accessed on Jul 2017
[6] http://www.oiv.int/public/medias/4710/oiv-noteconjmars2016-en.pdf
[7] http://fastml.com/predicting-wine-quality/
[8] Janert, P., “Data Analysis with Open Source Tools”, O’Reilly Media, 2010

Hello I enjoy what you guys are usually up too. This kind of clever work and coverage! Keep up the fantastic works guys I’ve you guys to my blogroll. danke
LikeLiked by 1 person